While Appium is most often used for functional testing (does the functionality of my app behave?), it can also be used to drive other kinds of testing. Performance is a big and important area of focus for testers, and one key performance metric is app launch time. From a user's perspective, how long does it take from the time they tap the app icon to the time they can interact with it? App launch time can be a big component of user frustration. I know for myself that if an app takes too long to load, I often switch to something else and don't even bother using it unless I absolutely have to.
Using Appium To Capture Launch Time
So, how can we check this? The main trick is to use one little-known capability:
Setting autoLaunch to false tells the Appium server to start an automation session, but not to launch your app. This is because we want to launch the app in a controlled and time-able manner later on. It's also important to remember that because Appium won't be launching the app for us, we're responsible for ensuring all app permissions have been granted, the app is in the correct reset state (based on whether we are timing first launch or subsequent launch), etc...
Once we have a session started, but no app launched, we can use the startActivity command to direct our app to launch, without any of the extra steps that Appium often takes during launch, so we get a relatively pure measure of app launch.
We might also care about not just how long the app takes to launch, but how long until an element is usable, so we can throw in a wait-for-element:
But this is just making the app launch; how do we actually measure the time it took? One technique would be to simply create timestamps in our client code before and after this logic, and get the difference between them. However, this would also count the time taken by the request to and response from the Appium server, which could add up to a lot depending on the network latency in between the client and server.
Ideally, we'd look for a number on the server itself, and thankfully this is something we can do thanks to Appium's Events API. Using the Events API, we can determine when exactly the startActivity command started and ended on the server. We can also find the difference between the end of the findElement command and the beginning of the startActivity command, which gives us a (not quite as accurate) measure of the time to interactivity of the app. (The reason it's not as accurate is that we do potentially have some time lost due to latency of the findElement command itself, which we could work around using Execute Driver Script).
Here's how we use the Events API to accomplish this:
Essentially, we get the events from the server, and pull out the CommandEvents for the commands we care about. Then we are free to compare their timestamps as necessary.
Comparing Performance Across Devices
Looking at app launch on emulators or the device you have on hand locally is all well and good, but it's also important to get a good idea of the metric across many different devices, as well as over time across builds. The basic technique we used above of simply printing the metric to the screen is obviously not a scalable way to track performance. In a real test environment, you'd want to log that metric to a database of some kind, for example CloudWatch, DataDog, Splunk, etc... Then you'd be able to see it in a nice dashboard and set alerts for performance degradations with new builds.
But let's talk a little bit about running on multiple devices. Since I don't have access to a bunch of devices, I put together an example of how to run this app launch time test on AWS Device Farm. The way Device Farm works is that you set up a test "run", uploading your app as well as a zipfile of your test project. To facilitate building the zipfile of my Java test with all its dependencies, I added these handy scripts to my build.gradle file:
With these scripts, whenever I need to generate a bundle for Device Farm, I can just run ./gradlew zip (after making sure the old files are deleted). The only change I had to make to my test code itself was to make sure to get the path to my uploaded app via an environment variable set by DeviceFarm:
When you create a test run on AWS, you walk through a wizard that asks you for a bunch of information, including the app and test bundle. At some point, you'll also have the opportunity to tweak the test configuration, which is in YAML format:
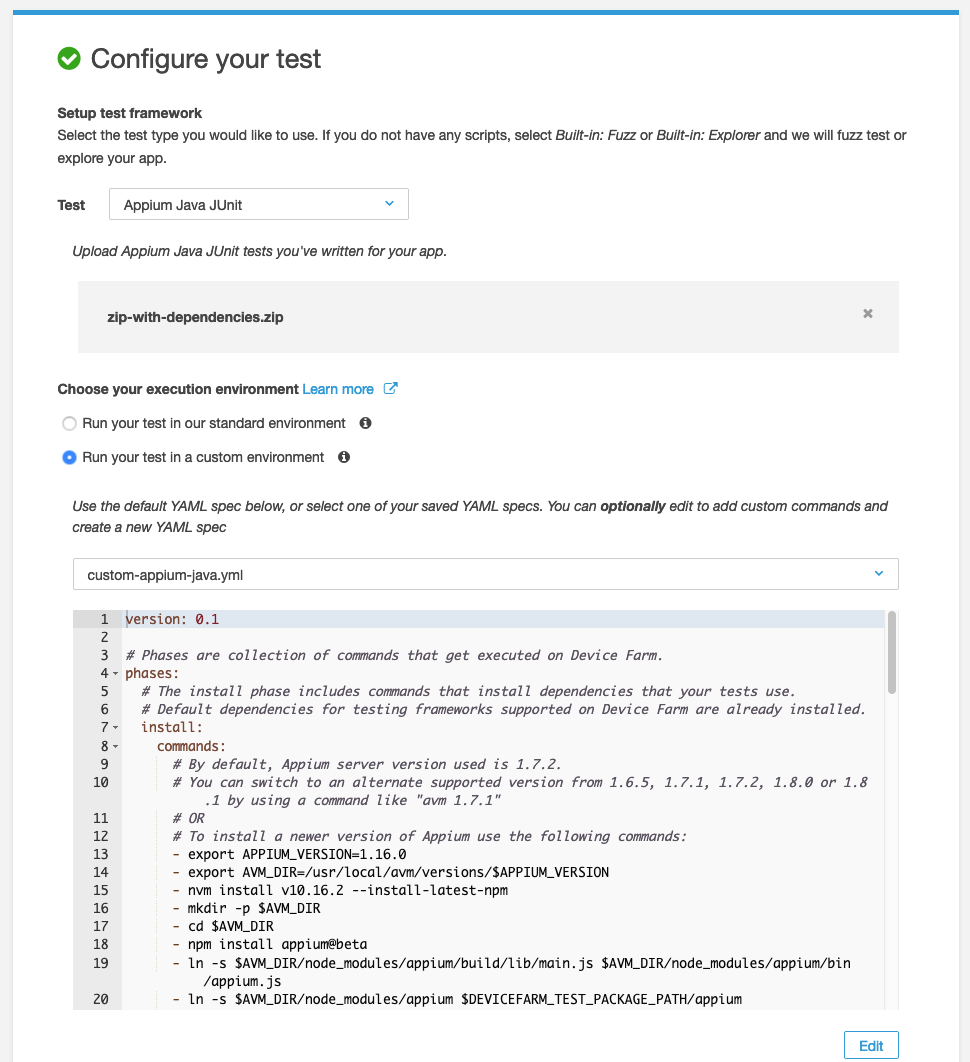
For this example, I needed bleeding-edge Appium features that are only available in a beta version, so I put together a custom Device Farm config that I pasted into the config section and saved for reuse. Note that I wouldn't recommend doing this on your own, but instead use the default config and one of the tested and supported versions of Appium.
Once I've got the run all ready to go, I can choose which devices I want to run on. For this article, I chose to run on 5 devices:
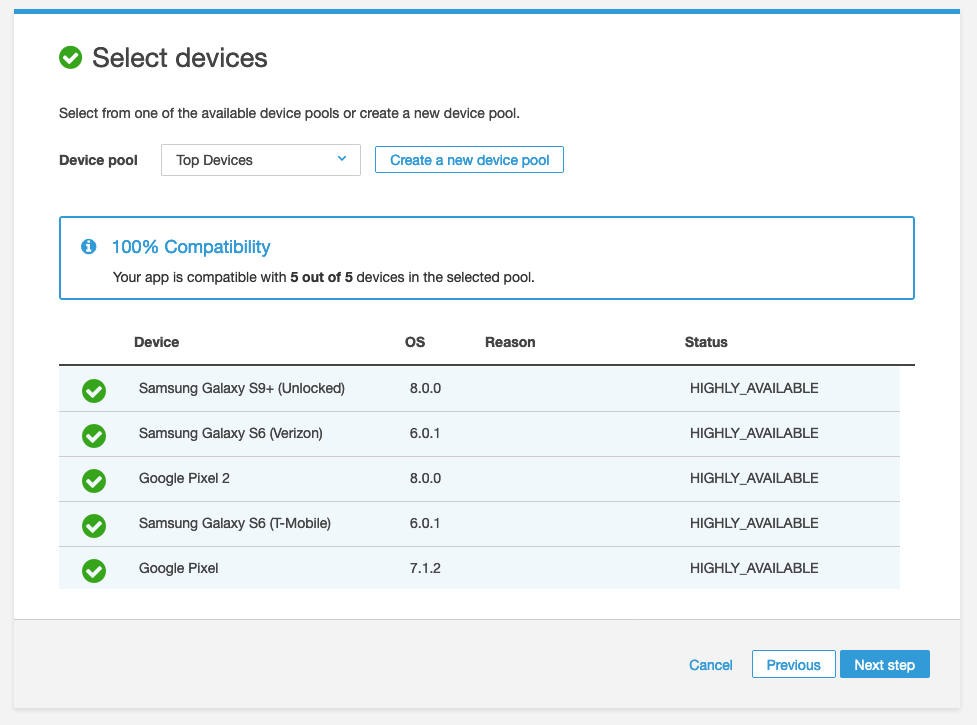
Device Farm's model is pretty different from other services I've used before. Rather than running the Appium client locally and talking to a remote server, the test bundle is uploaded to AWS via this wizard, and then the tests are scheduled and executed completely remotely. So at this point I sat back and waited until the tests were complete. When they were, I was able to see the results for all devices (they passed--eventually, anyway!)
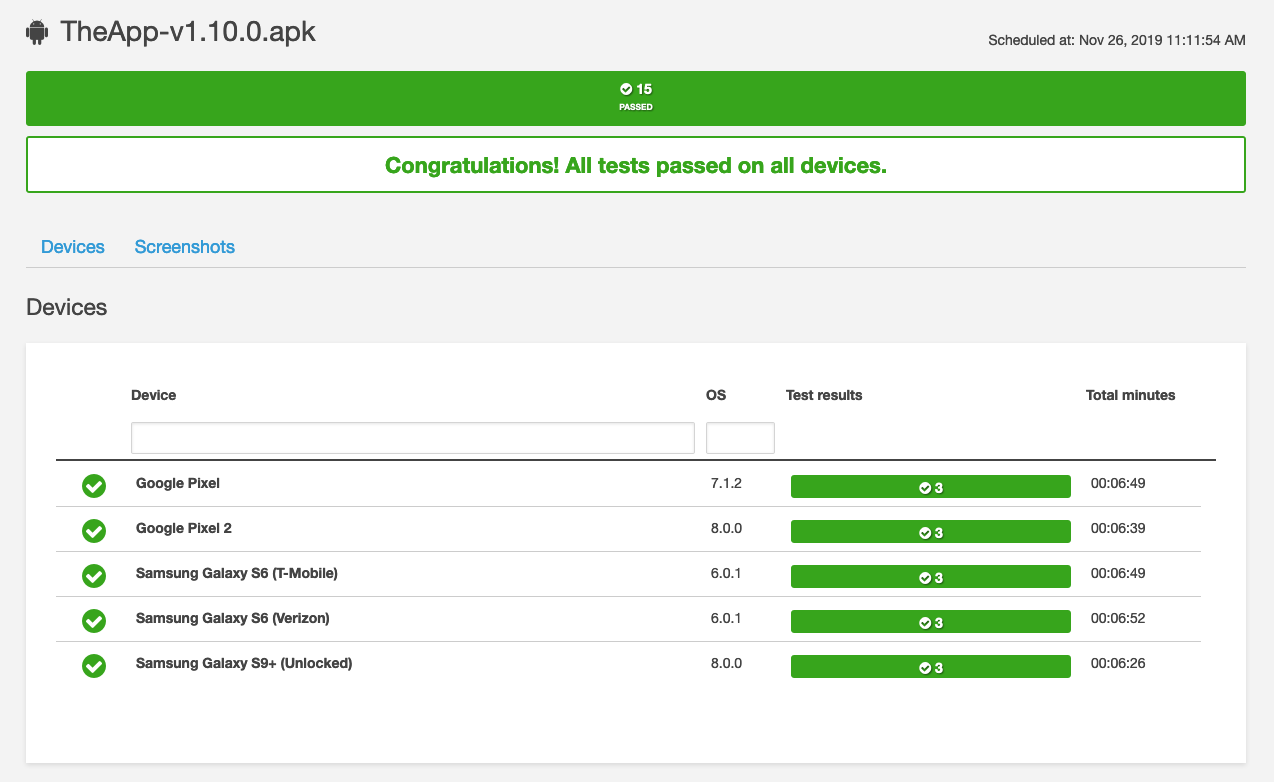
Since I just printed the launch time metrics to stdout, I had to dig through the test output to find them. When I did, these were the results:
DeviceTime to launchTime to interactivityGoogle Pixel2.554s3.263sGoogle Pixel 22.064s2.291sSamsung Galaxy S6 (T-Mobile)2.392s5.201sSamsung Galaxy S6 (Verizon)2.392s4.468sSamsung Galaxy S9+2.404s2.647s
That's it! I definitely encourage all of you to start tracking app launch time in your builds, as even a few seconds can make a big difference in user satisfaction. Want to check out the full source code for this article's test? As always, you can find it on GitHub.


-1280X720-Final-2.jpg)

