With BFSI apps, customers expect to check balances, make payments, or execute trades instantly and smoothly. For service providers, this means ensuring and maintaining consistent, high-quality app performance.
This endeavor is met with challenges like high latency, which can cause delays in performing time-sensitive transactions like paying a bill in a busy restaurant. Other challenges include downtime or a poor user experience under varying network conditions. These challenges directly impact user trust, so addressing them is vital.
A key approach is to visualize and analyze quality data generated from performance testing, enabling effective monitoring and issue resolution.
Grafana for Performance Monitoring
Unified Dashboards
With Grafana, you can aggregate critical metrics such as transaction latency, throughput, error rates, and page load into cohesive, real-time dashboards. You gain immediate visibility into performance anomalies, enabling faster detection and resolution.
Customized Visualizations
Grafana offers extensive customization, providing tailored dashboards for different stakeholders. Technical teams can monitor server and network metrics, while business teams view transaction rates and financial KPIs. This flexibility enhances strategic decision-making and operational responsiveness.
Advanced Alerting
Grafana’s powerful alerting engine can notify teams of predefined performance threshold breaches, such as when trading volumes spike. Real-time alerts enable proactive issue management, significantly reducing incident impact.
Integration and Automation
Grafana seamlessly integrates with CI/CD pipelines and automation tools, supporting continuous updates to monitoring dashboards. Financial institutions can thus keep pace with rapidly evolving applications and infrastructure, maintaining continuous, accurate performance monitoring.
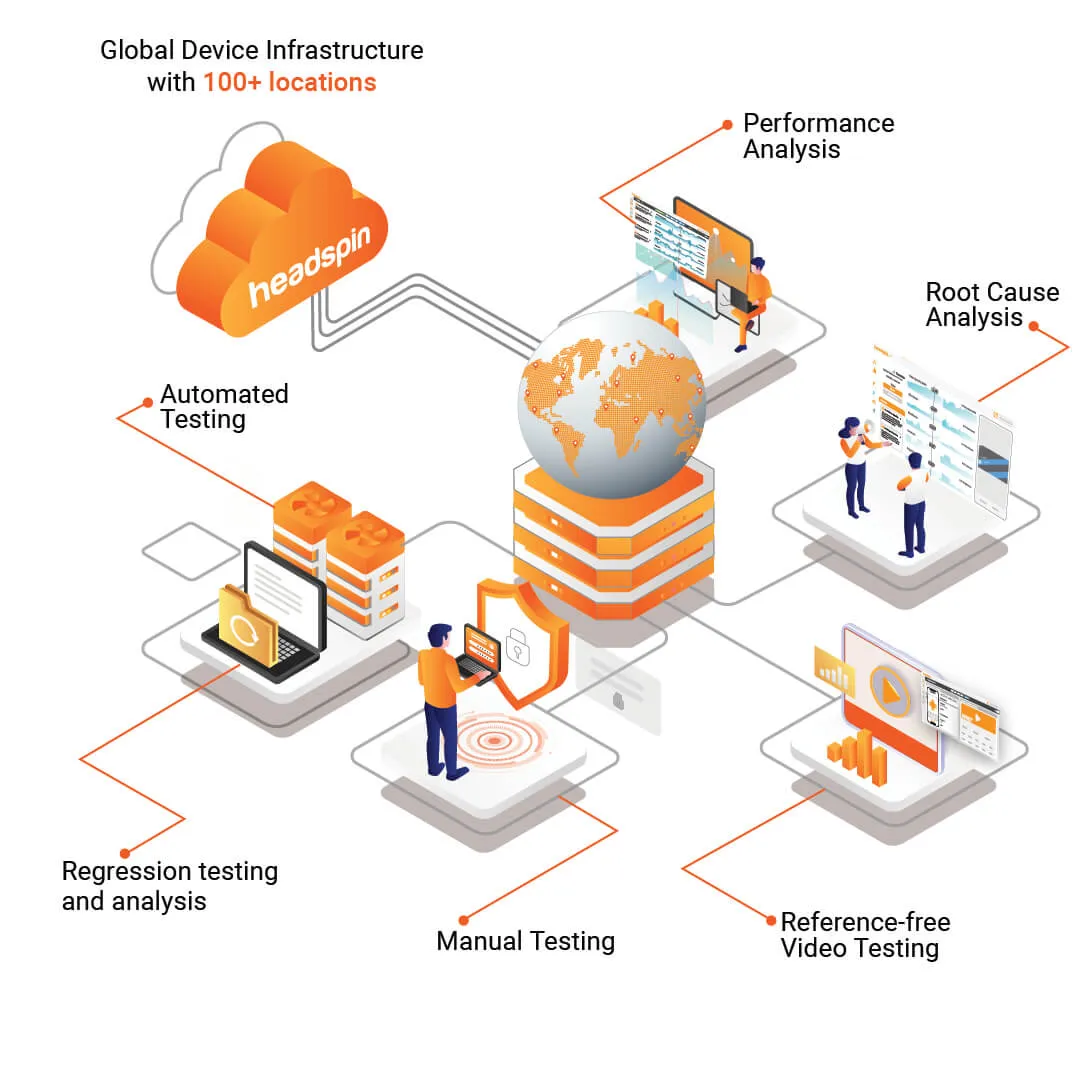
Integrating Grafana with HeadSpin for Enhanced Insights
Grafana’s monitoring capabilities become even more powerful when combined with HeadSpin's testing solutions:
Network Condition Emulation


HeadSpin simulates diverse network scenarios, capturing detailed performance metrics under conditions like high latency and packet loss. These data points feed directly into Grafana dashboards, enabling proactive performance optimization and improving user experiences across various network environments.
Cross-Device Performance Testing

HeadSpin’s global device cloud provides detailed metrics on application performance across numerous devices and operating systems. Grafana visualizes these metrics clearly, highlighting any device-specific performance issues, allowing targeted optimizations.
Region-Specific Monitoring

Leveraging HeadSpin’s global testing nodes, organizations can perform simultaneous regional performance tests. Grafana then visualizes these metrics, clearly indicating regional performance disparities. This approach ensures global performance consistency, significantly enhancing customer satisfaction.
Continuous Regression Testing
Integrating HeadSpin’s automated regression testing data into Grafana dashboards allows organizations to track build-over-build performance trends. Teams can immediately identify performance regressions introduced by new features or updates, enabling prompt remediation.
Benefits to BFSI Organizations
- Enhanced Reliability and Uptime: Real-time monitoring combined with proactive testing drastically reduces downtime by swiftly identifying and resolving performance anomalies.
- Optimized Performance: Detailed metrics drive precise performance tuning, significantly reducing latency and enhancing the user experience.
- Improved User Experience and Satisfaction: By simulating real-world usage scenarios, institutions ensure robust performance across all conditions, increasing customer trust and satisfaction.
- Innovation with Confidence: Comprehensive performance monitoring and testing frameworks empower institutions to innovate confidently, ensuring their applications' reliability and performance.
Conclusion
Integrating Grafana’s powerful visualization capabilities with HeadSpin’s real-world performance testing provides BFSI organizations with unparalleled insights and proactive monitoring tools. This combination ensures exceptional digital experiences characterized by reliability, speed, and customer satisfaction, essential for success in today’s competitive financial landscape.
By visualizing performance clearly and accurately, BFSI institutions can confidently deliver outstanding digital services, securing customer loyalty and business growth.
FAQs
Q1. Is Grafana suitable for non-technical stakeholders?
Ans: Absolutely. Grafana's intuitive visualizations and customizable dashboards can be tailored to present business-focused metrics clearly, making it accessible for non-technical stakeholders such as business analysts and executives.
Q2. What security measures does Grafana offer for sensitive financial data?
Ans: Grafana provides robust security features, including role-based access control, secure data source connections, audit logging, and encryption options. At HeadSpin, we use only synthetic data for testing purposes, ensuring that no real customer or sensitive financial data is exposed during performance monitoring or visualization.
Q3. How scalable is Grafana for large enterprises?
Ans: Grafana is highly scalable, supporting large-scale deployments with numerous data sources and dashboards. Enterprise editions offer enhanced scalability, performance, and additional administrative controls.