.png)


.png)


AI-Powered Key Takeaways


Android users expect apps to be fast, smooth, and reliable, regardless of the device they use or the network they are on. In reality, achieving consistent performance on Android is challenging due to device fragmentation, varying hardware capabilities, and constantly changing network conditions.
An app that works perfectly in ideal environments can still struggle with slow load times, UI lag, or crashes in real-world usage. This is where Android app performance testing becomes essential. It helps teams understand how an app behaves under different conditions, identify bottlenecks across the frontend and backend, and ensure a seamless user experience before issues reach production.
What Is Android App Performance Testing?
Android app performance testing evaluates how an application behaves under real usage conditions, with a focus on responsiveness, stability, and resource efficiency.
Functional testing confirms whether a feature works. Performance testing answers a different question: what happens when that feature is used repeatedly, under load, on constrained devices and unstable networks.
On Android, this becomes more critical because:
- Devices operate with limited CPU and memory
- Background processes compete for resources
- Network conditions vary constantly
A feature can pass all functional tests and still fail in production due to delays, freezes, or resource exhaustion.
6 Reasons Why Android App Performance Testing Is Critical in 2026
1. Device Fragmentation Creates Inconsistent Performance
Android apps run on a wide range of devices with different CPU, memory, and GPU capabilities. An app that performs well on a high-end device may lag or crash on lower-end devices where resource limits are quickly reached.
2. Network Conditions Vary Constantly
Users operate across 5G, 4G, Wi-Fi, and unstable networks. Under these conditions, API calls can slow down, retry, or fail. Without testing under constrained networks, apps appear stable in testing but fail in real usage.
3. Backend Dependencies Directly Impact User Experience
Modern apps rely on multiple APIs and services. Delays in any dependency affect screen rendering and user actions. Performance testing helps identify where these dependencies introduce latency or failure.
4. Issues Build Over Time, Not Instantly
Problems such as memory leaks, CPU overuse, and inefficient background processing often do not appear in short sessions. They surface during extended usage and lead to slowdowns or crashes.
5. Users Drop Off When Performance Degrades
Delays during app launch, navigation, or transactions reduce engagement. Repeated issues result in poor ratings and uninstalls.
6. Resource Misuse Affects Overall Device Behavior
Apps that consume excessive CPU, memory, or battery impact the entire device. This leads to degraded performance beyond the app itself, which users associate with poor app quality.
Key Metrics in Android App Performance Testing
Performance testing depends on tracking a set of core metrics that reflect how the app behaves under real usage. Each metric captures a different aspect of responsiveness, resource usage, or stability.
1. App Launch Time
Measures how long it takes for the app to become usable after it is opened. This includes cold, warm, and hot starts. Delays during launch often come from heavy initialization, blocking operations, or large dependency loading, and are one of the first issues users notice.
2. Frame Rendering (FPS)
Indicates how smoothly the UI renders during interactions such as scrolling or navigation. Android targets 60 frames per second. Drops in frame rate result in visible stutter, delayed touch response, and a perception that the app is slow even if backend responses are normal.
3. API Response Time
API Response Time captures how long backend requests take to complete. This directly affects how quickly data appears on screen. Slow or inconsistent response times lead to prolonged loading states, partial rendering, and failed user actions, especially in flows like login or transactions.
4. CPU Usage
Represents how much processing power the app consumes during operation. High CPU usage during interactions can cause input delays, overheating, and reduced performance on lower-end devices. Sustained CPU usage in the background often indicates inefficient processing or unmanaged tasks.
5. Memory Usage (PSS)
Tracks how much memory the app occupies while running. Android uses PSS (Proportional Set Size) to reflect actual memory impact, including shared memory. Increasing memory usage over time without release is a common sign of memory leaks, which can lead to slowdowns, crashes, or the system terminating the app.
6. Battery Consumption
Measures how much power the app uses during active and background states. Excessive battery usage usually comes from continuous background activity, frequent network calls, or high CPU usage, and directly impacts user retention.
7. Network Usage
Tracks how much data the app consumes and how efficiently it communicates with backend services. High or inefficient network usage leads to slower performance on limited connections, increased data costs for users, and repeated loading of the same content.
Types of Android App Performance Testing
1. Load Testing
Login works fine with a few users. Add more users hitting the same flow at once and response time starts stretching. That situation is where load testing is applied.
2. Stress Testing
Keep increasing traffic beyond expected limits and things begin to fail. Requests drop, services stop responding, and recovery is not immediate. Stress testing is meant to expose that point.
3. Scalability Testing
Performance does not fail suddenly. It shifts as traffic grows. Latency rises gradually and throughput stops improving after a threshold. Scalability testing tracks that behavior.
4. Endurance Testing
Run the same flows long enough and the system changes. Memory does not return to baseline, CPU remains active, and the app slows down over time. Endurance testing is used to observe this.
5. Spike Testing
Traffic does not always build up. Sudden bursts hit the system without warning. Queues form quickly and systems take time to stabilize. Spike testing focuses on these abrupt changes.
6. Network Testing
Stable networks are not the default. High latency, packet loss, and weak bandwidth affect how requests complete and how often retries happen. Network testing covers these conditions.
7. Volume Testing
Large amounts of data behave differently than high user traffic. Lists take longer to render, memory pressure increases, and processing slows down. Volume testing targets this scenario.
Real Devices vs Emulators in Android App Performance Testing
Performance behavior on Android is tightly linked to hardware limits and network conditions. The environment used for testing determines whether those constraints are visible or completely missed.
Emulators
Emulators run Android in a simulated environment on desktop hardware. Setup is quick and useful during early stages when basic flows need to be validated.
That convenience comes at a cost. Resource behavior is not realistic. CPU, memory, and battery usage do not reflect how the app will behave on an actual device. Network conditions are also approximated, not experienced.
Because of this, emulator results tend to look stable. Frame drops are harder to reproduce, memory pressure rarely builds up in the same way, and long-session degradation often goes unnoticed.
An app that looks responsive on an emulator can still struggle once real constraints are introduced.
Real Devices
Real devices expose the limits that actually matter. CPU throttling under sustained usage, memory constraints on mid-tier devices, and thermal impact all influence performance.
Network behavior is also different. Variability across carriers, regions, and signal strength introduces delays, retries, and failures that cannot be reliably simulated.
Issues such as UI stutter, memory buildup over time, battery drain, and device-specific slowdowns become visible only in this environment.
Choosing Between Emulators and Real Devices for Performance Testing
Emulators help move quickly during early development, but they do not represent real usage conditions. Relying on them for performance validation creates a gap between test results and production behavior.
Real performance issues emerge under constraint:
- Limited memory on lower-end devices
- Sustained CPU usage during long sessions
- Unstable or high-latency networks
These conditions expose problems that emulators fail to surface.
An app that passes all performance checks in an emulator can still:
- Drop frames during interaction on real devices
- Slow down over time due to memory growth
- Fail under poor network conditions
Performance testing that excludes real devices ends up validating ideal scenarios instead of actual user experience.
Also Read our related article - Real Device Cloud vs Emulator for Mobile App Testing – What Should You Use?
Best Tools for Android App Performance Testing (2026)
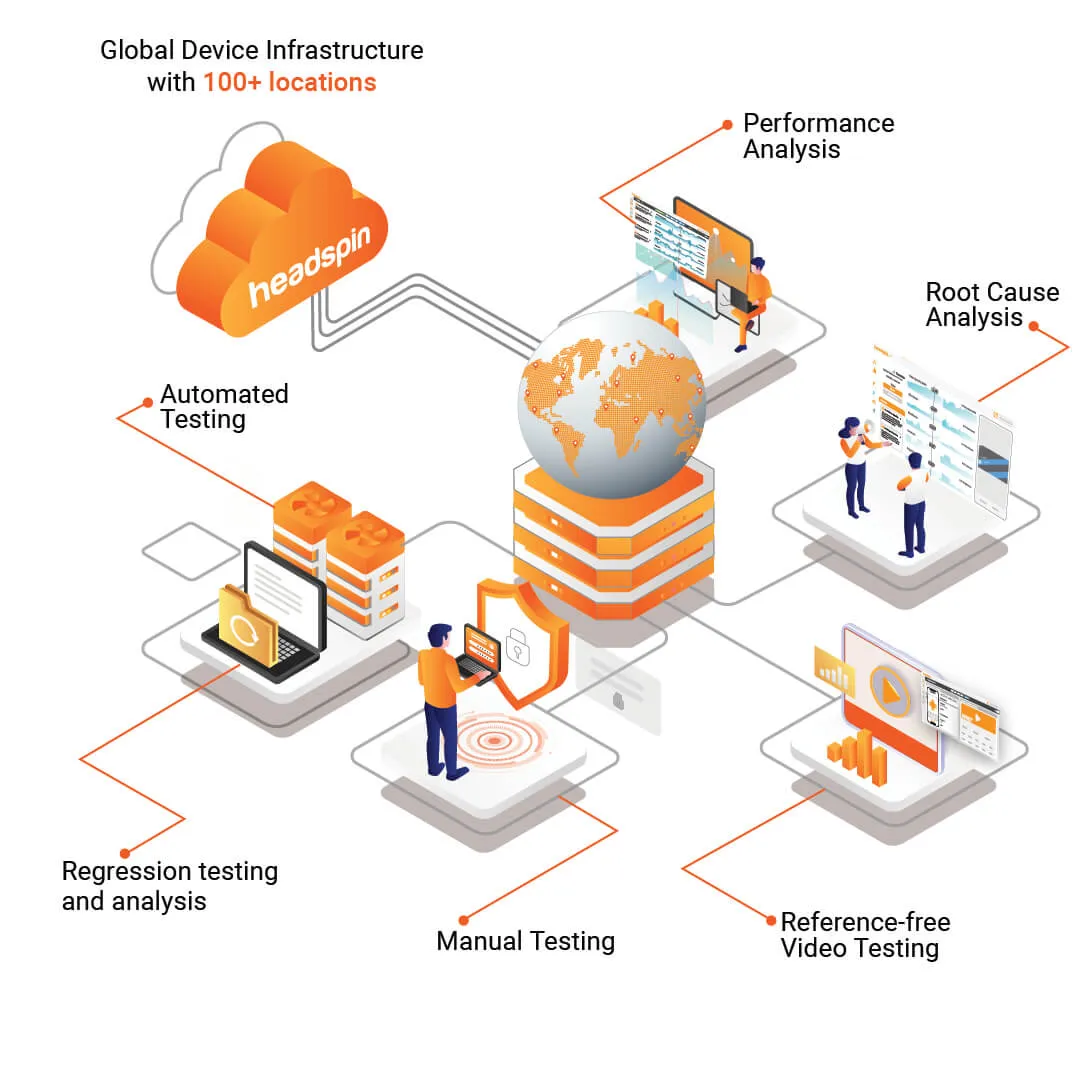
1. HeadSpin
HeadSpin enables performance testing on real devices distributed across different geographies and carrier networks. Instead of relying on simulated environments, it allows teams to execute tests under actual user conditions where device constraints, network variability, and regional differences directly impact app behavior.
This makes it possible to observe how performance changes across locations, how apps behave on different carriers, and how issues such as latency, packet loss, or device limitations affect real user flows. It also provides session-level visibility, helping teams connect performance issues to specific interactions, API calls, or rendering problems.
Key Features
- Real device infrastructure across global locations
- Testing across real carrier networks
- Session-level performance insights with root cause visibility
- Support for automation framework integration
Ideal For
Teams that need to validate performance under real-world conditions where device, network, and geography influence user experience.
2. Appium
Appium is an automation framework that also exposes performance data on Android devices during test execution, enabling teams to capture system metrics alongside functional tests.
Key Features
- Access to CPU, memory, battery, and network data
- Integration with existing automation suites
- Support for continuous testing workflows
- Commands like getPerformanceData for metric extraction
Ideal For
Teams looking to combine functional automation with basic performance monitoring across builds.
3. Android Profiler (Android Studio)
Android Profiler provides detailed visibility into how the app behaves at runtime, including CPU activity, memory allocation, and network usage, making it useful for diagnosing performance issues.
Key Features
- Real-time CPU, memory, and network tracking
- Thread-level activity analysis
- Heap and allocation inspection
- Energy usage monitoring
Ideal For
Developers investigate performance bottlenecks and identify root causes during development.
4. JMeter
JMeter is used to simulate user traffic at the API level, helping teams evaluate how backend systems perform under load and how that impacts app behavior.
Key Features
- Load and stress testing for APIs
- Concurrent user simulation
- Request and response time analysis
- Integration with CI pipelines
Ideal For
Testing backend scalability and understanding how API performance affects mobile app experience.
How to Perform Android App Performance Testing (Step-by-Step)
Step 1: Define a real user journey
Pick one complete flow such as opening the app, logging in, loading the dashboard, and performing an action. Testing individual screens does not show how delays build across steps.
Step 2: Run it once on a real device
Use a mid-range device and go through the flow without any tools. Notice where the app slows down, where screens take longer to load, and where interactions feel off.
Step 3: Run the same flow with profiling enabled
Repeat the flow while capturing CPU, memory, and network activity. At this point, the goal is to connect what you saw earlier with actual signals such as slow API calls or spikes in resource usage.
Step 4: Change the conditions
Run the same flow again, but not under ideal conditions. Add network latency or reduce available memory. The same steps will behave differently once constraints are introduced.
Step 5: Repeat the flow multiple times
Run it several times in a row. Some issues only appear after repeated use, especially memory buildup or gradual slowdown.
Step 6: Increase backend load
Slow down the APIs or simulate traffic using a tool like JMeter. Run the same flow again and observe how delays on the backend affect what the user sees.
Step 7: Fix and validate
Make changes and run the exact same flow again under the same conditions. Improvements should show up clearly if the issue is resolved.
Common Android Performance Challenges and How to Address Them
How HeadSpin Enables Advanced Android App Performance Testing
Android performance issues rarely come from a single layer. A delay on screen can come from the network, backend, device constraints, or rendering. The challenge is identifying where the issue actually originates.
HeadSpin makes this easier by:
- Bringing user actions, network activity, and device metrics into a single view, so issues can be analyzed in context instead of across separate tools
- Helping trace slowdowns to a specific layer, whether it is an API delay, network variability, or app-side processing
- Running tests on real devices across carrier networks, exposing latency variation, packet loss, and device-specific behavior
- Allowing the same flows to be repeated across devices and locations to check if issues are isolated or consistent
FAQ
Q1. What are the key metrics to track in Android app performance testing?
Ans: The most important metrics include app launch time, frame rate (FPS), API response time, CPU usage, memory usage, battery consumption, and network usage. Together, these metrics help identify bottlenecks affecting speed, stability, and overall user experience.
Q2. What are the best tools for Android app performance testing?
Ans: Popular tools include HeadSpin for real-device testing, Appium for automation with performance data, Android Profiler for in-depth analysis, and Apache JMeter for backend load testing. The right choice depends on whether you need real-world testing, debugging, or scalability validation.
Q3. How do you choose the right Android app performance testing tool?
Ans: Start by identifying your needs: real-device testing, automation, or backend performance. Tools like HeadSpin are ideal for real-world conditions, while Appium suits automation workflows. Consider factors like scalability, integrations, budget, and whether the tool supports testing across devices and networks.
Q4. Can emulators be used for Android performance testing?
Ans: Emulators are useful for early-stage testing and debugging, but they do not accurately reflect real-world performance. They cannot replicate real CPU, memory, battery, or network conditions. For reliable results, performance testing should always be validated on real devices.
Q5. Are there affordable Android app performance testing solutions for startups?
Ans: Yes, startups can combine open-source tools like Appium and Apache JMeter with limited real-device testing platforms like HeadSpin. This hybrid approach reduces cost while still covering critical real-world performance scenarios.


-1280X720-Final-2.jpg)